充放電過程中 バッテリーの充電深度と放電深度が変化すると、電圧も変化します。 常に変化しています。水平座標と電圧として容量を使用する場合 垂直座標として、単純な充放電曲線を取得できます。 これには、バッテリーの電気的性能に関する多くの手がかりが含まれています。これら 時間、容量、SOC、 充電や放電に関わる電圧などを座標として電荷といいます。 そして放電曲線。ここでは、一般的な充電曲線と放電曲線をいくつか示します。
時間-電流/電圧曲線
→定電流
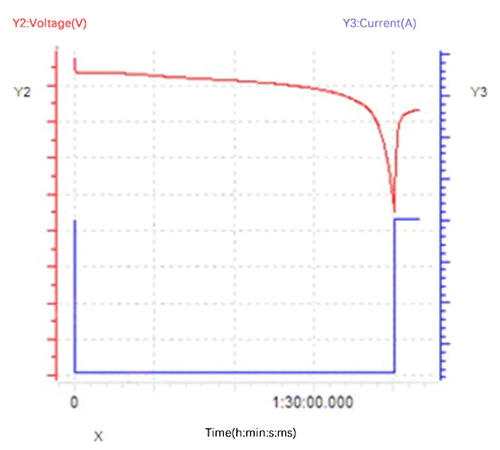
定電流充電時と 放電中、電流は一定、バッテリー端子の変化 電圧も同時に収集され、電圧の検出によく使用されます。 バッテリーの放電特性。放電プロセス中に、 放電電流は変化せず、バッテリー電圧は低下し、 放電電力も減少し続けます。サンプル曲線を次の図に示します。 以下の図。
…定電流・定電圧 (充電中)
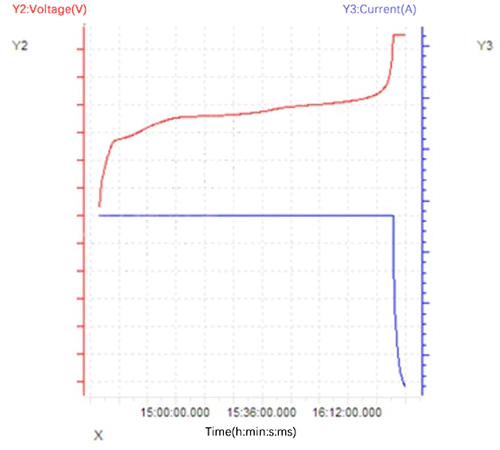
定電流充電と比べて、 定電流定電圧充電には定電圧プロセスがあり、 充電終了。充電が終わると電圧は一定になります。 電流は徐々に減少しながら目標値に達します。とき カットオフ電流に達すると、定電流定電圧充電 終わります。プラトーを抜けた後はバッテリー電圧が大きく変動するため このまま定電流充電を続けると、バッテリーが限界値に到達できなくなります。 理想的なフル充電状態。したがって、定数に切り替える必要があります 電圧を下げて電流を減らして、バッテリーがより高い電圧に達するようにします 可能な限り充電状態を維持します。サンプル曲線を図に示します。 以下。
? 定電力
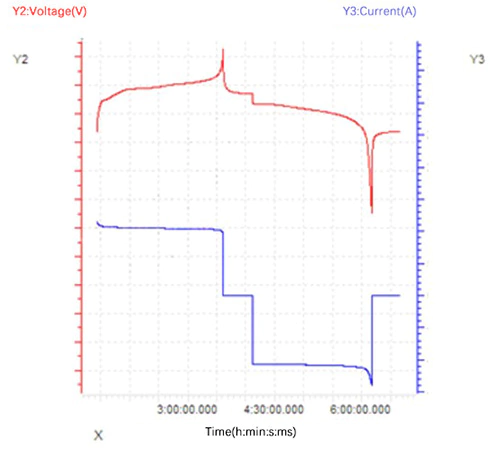
充電と放電のプロセス全体 定電力で動作します。 P=UIに従って、電圧は徐々に上昇します 定電力充電中は電流が増加し、徐々に減少します。 電圧は徐々に減少し、電流は徐々に増加します。 一定の電力を放電します。従来の充電と LFPバッテリーの放電終止電圧3.65-2.5V、放電終止電流 充電終了電流の約 1.5 倍に達する可能性があります。曲線の例を示します 以下の図に示されています。
→連続、断続、パルス
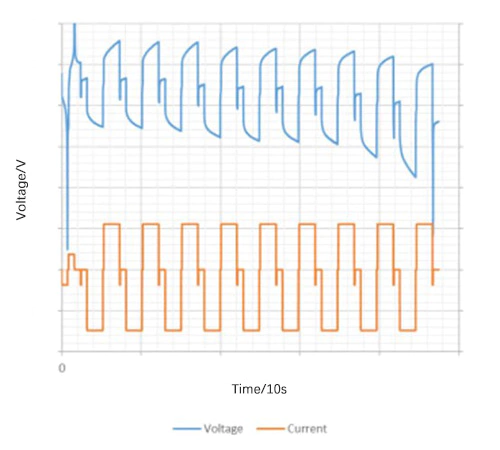
定電流または定電力では、タイミング 機能は連続、断続、パルス充電を実現するために使用されます。 放電制御。これらの特殊な充電および放電方式は、多くの場合、次の目的で使用されます。 バッテリーのDC内部抵抗を評価します。サンプル曲線が表示されます 以下の図にあります。
容量-電圧曲線
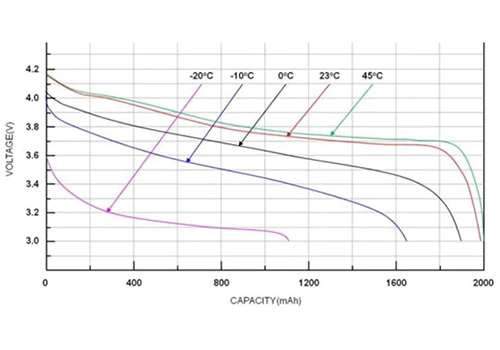
横軸は容量-電圧 曲線はバッテリーの充放電容量、充電状態、および その他の情報、縦軸にはバッテリーの電圧が含まれます プラットフォーム、変曲点、分極化およびその他の情報。フィギュア 以下は、さまざまな環境におけるリン酸鉄リチウム電池の放電曲線です。 温度。
金利曲線
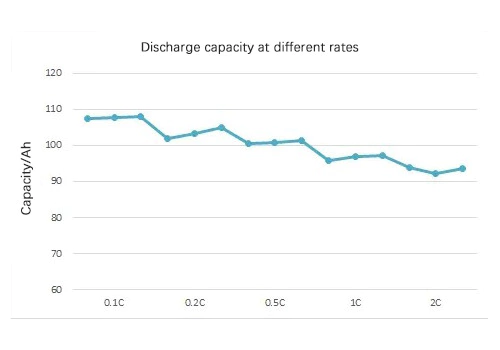
電流密度は電流の速度に影響を与えます。 電気化学反応により、性能パラメータが変化します。 バッテリー。容量の異なる電池を比較すると、同じ電流が流れます。 適用できないため、相対電流を決定するためにレートが使用されます。のために たとえば、0.1C は 3Ah 18650 バッテリーの場合は 0.3A、280Ah 角形バッテリーの場合は 28A です。 バッテリー。簡単に言えば、レートで表される具体的な電流値は、 レートにバッテリー容量を乗算します。
バッテリーの容量をマークするときは、 容量が大きいため、充放電電流を考慮する必要があります。 レートが異なると異なります。たとえば、の容量を校正するには、 バッテリーを異なるレートで使用する場合は、 充電と放電のサイクル レートを計算し、放電によるレート曲線を描きます。 縦軸は容量、充放電回数は 横軸。
dQ/dV カーブ
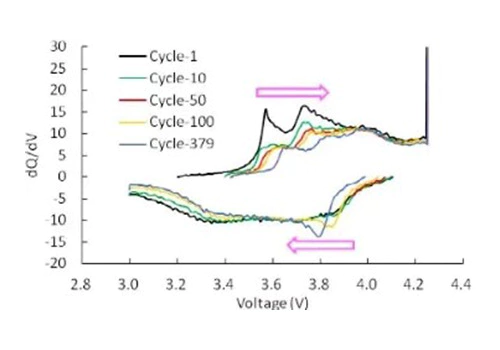
dQ/dV 曲線の名前はその y 軸です 変数、つまり単位電圧間隔あたりの体積の変化率。 dQ/dV 曲線の横軸は通常、SOC、容量、または電圧です。 これは容量の変化率の変化を反映しています。場所 変化率が大きい場合は、曲線上の特徴的なピークとして表示されます。 これは一般に電気化学反応プロセスに相当します。
dQ/dV 曲線から、 バッテリーの電圧プラットフォームは、電気化学反応が起こると、 バッテリーの経年劣化やその他の変化に応じて反応プロセスがどのように変化するか 州。一般に、化学反応は速いため、データは次のようになります。 曲線にはより高い精度が必要です。したがって、出力 dQ/dV 曲線は次のようになります。 生データの収集には特定の要件が必要です。それ以外の場合は不可能です 明確なピークを持つ曲線を作成します。充放電テストを行うときは、 収集する電圧間隔ÎV=10~50mVを設定可能 データ、または時間間隔 t=10-50ms、その後画面 電圧差が等しい生データ。
次の図は dQ/dV 曲線を示しています。 異なるサイクル数で。
サイクルカーブ
私たちが知っているバッテリーの寿命は カレンダー寿命とサイクル寿命に分けられます。カレンダーの寿命はそれにかかる時間です 自然放置ではバッテリー容量がある程度減少しますので、 一方、サイクル寿命はバッテリーが継続的に充電される回数であり、 ある程度容量が減衰するまで放電してください。サイクルライフは次の 1 つです。 バッテリー寿命のパフォーマンスを測定するための重要な指標。
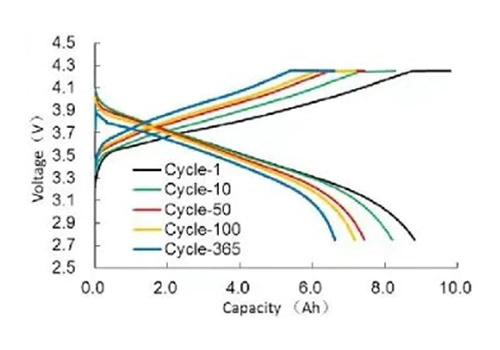
リチウムイオンのサイクル試験データ Battery は 1 回の充電および放電データの蓄積です。違う 単一の充放電データを抽出して複数の曲線を作成できます。 分析のさまざまな側面。最も単純なサイクル寿命曲線は次の数値で表されます。 横軸はサイクル数、放電容量または容量維持率 以下の図に示すように、y 軸として。サイクルが進むにつれて、 バッテリー容量は減少し続けており、充放電システムには バッテリー容量の低下に重大な影響を及ぼします。
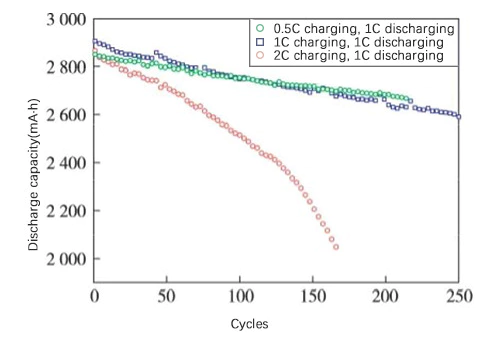
容量と電圧の比較もできます 図に示すように、さまざまな時点での充電と放電の曲線 下に。サイクルが進むと充放電開始電圧が 変化すると、バッテリーの DC 内部抵抗が変化し、充電と 放電容量は徐々に減衰します。
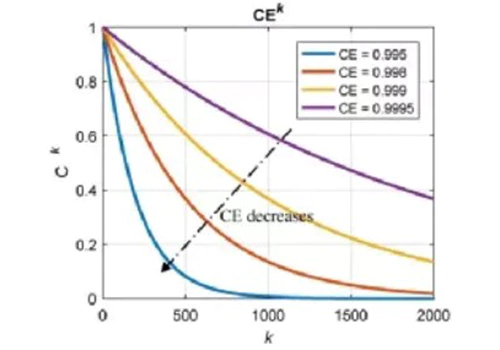
上記2種類の他に、 横軸がサイクル数である他の多くの曲線です。 縦軸はバッテリサイクル減衰の影響を受けるパラメータで、 バッテリーのサイクル寿命に影響を与える要因を分析する役割を果たします。 セルとサイクル寿命を予測します。下図のように反映されます。 クーロンの影響を受けるバッテリーのサイクル寿命の理論値 効率レベル。 CE はクーロン効率、Ck は容量保持率です。 レート、k はサイクル数です。
TOB NEW ENERGY は、電池の研究と製造のための 電池テスター のフルセットを提供しています